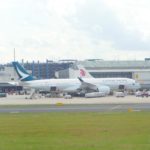
Iberia’s consolidated results for the first quarter of 2006 showed a loss of 45 million euros, which was 29 million euros worse than the results obtained in the same quarter last year.
The principal cause was the steep rise in the price of aviation fuel, on which the company spent 80 million euros more than in the first quarter of 2005.
Unit operating income was up by 5% in the quarter from same-2005, continuing the trend set in the second quarter of last year. This was due chiefly to higher unit passenger revenues on international routes.
The load factor reached 75.7%, up 0.9 points from the level marked a year ago, even though this year Easter Week fell in the second quarter. In keeping with the trend of recent months, international routes in general performed well, and the load factor on long-haul routes reached 85.8%.
The number of passengers carried in the first quarter increased by 1.9%. The largest growth –9.2%– was posted on medium-range routes.
When fuel costs are excluded from consideration, unit operating expenses rose by 1.4% with respect to their year-ago level, which was largely due to the move of Iberia operations to the new T4 terminal complex at Madrid-Barajas airport, the appreciation of the dollar, and the positive impact in 2005 of the application of the IAS rules to income from the leasing of aircraft.
Despite the drop in operating results, the EBITDAR declined by only 7%, leaving an accrued EBITDAR margin of 8.3% in the first three months of the 2006.
Staff productivity, measured in available seat kilometres (ASKs) per employee, climbed by 4% with respect to the same quarter in 2005, while the fleet utilisation rate rose by 1.6%.
April Traffic Statistics
Overall, revenue passenger kilometres (RPKs) were up by 18.7% in April with respect to the same month of 2005, while available seat-kilometres (ASKs) were increased by only 6.1%. This signified an 8.7% improvement in the load factor, to 82.3%, the highest for April in company history. Iberia carried 2.5 million passengers in the month, 7.2% more that in same-2005. The average length of Iberia routes increased by 10,7%.
The sharp increase in demand was fuelled in part by the Easter Week travel since the holiday fell in April this year, while last year it came in March. However, cumulative data for the past two months show notable year-on-year growth: RPKs were up 10.8%, while ASKs increased by 5.3%, and the load factor climbed 2.9 points from March-April 2005, reaching 80.0%.
In April, 2006, long-haul passenger traffic grew by 26%, twice the growth of seat/kilometre supply (13.2%). All three routes over the Atlantic (North, Middle, and South) posted growth of both passenger volume and occupancy. Routes to Uruguay, Argentina, Colombia and Puerto Rico put in especially good performances..
On medium-range international flights the load factor improved by 12.4 from April of last year. This was a sharp increase in demand on routes to most destinations (and average of 20%), the best performers being Greece, Israel and Morocco, followed by Denmark and Austria.
ON domestic routes the load factor increased by 3.3 points to 76.4%, while supply was down by 4.6%, thanks to a decease in frequencies on certain routes during Easter Week.
Key Figures (unaudited) (a)
|
IBERIA GROUP |
1st Quarter (Jan. – Mar.) |
||
|
Thousands of € |
2006 |
2005 |
% |
|
Operating income |
1,206,816 |
1,118,517 |
7.9 |
|
Operating expenses |
1,271,518 |
1,154,059 |
10.2 |
|
Operating results |
-65,428 |
-31,208 |
-109.7 |
|
EBITDAR) (b) |
100,213 |
107,913 |
-7.1 |
|
Operating earnings (b) |
-63,513 |
-31,124 |
-104.1 |
|
Consolidated earnings |
-44,964 |
-16,097 |
-179.3 |
|
Net assets (c) |
1,693,615 |
1,738,233 |
-2.6 |
|
Net balance sheet debt (c) |
-1,169,179 |
-1,142,390 |
2.3 |
|
Net debt adjusted x 8 (c) |
1,848,430 |
1,739,125 |
6.3 |
|
ASKs (millions) |
15,689 |
15,261 |
2.8 |
|
RPKs (millions) |
11,876 |
11,421 |
4.0 |
|
Load Factor (%) |
75,7 |
74,8 |
0.9 p. |
|
Passenger revenues |
884,567 |
810,854 |
9.1 |
|
Passenger revenues / RPK (eurocents) |
7,45 |
7,10 |
4.9 |
|
Passenger revenues / ASK (eurocents) |
5,64 |
5,31 |
6.1 |
|
Operating income / ASK (eurocents) |
7,69 |
7,32 |
5.0 |
|
Operation expenses / ASK (eurocents) |
8,10 |
7,53 |
7.5 |
|
Operating expenses ((exc. fuel) / ASK (eurocents) |
6,45 |
6,37 |
1.4 |
(a) Report compiled in accordance with International Financial Information Standards (NIIF).
(b) Does not include non-recurring income and expenses.
(c) March 2006 vs. December 2005.
No. of shares: 947,893,931 on March 31, 2006, and 943,161,939 on December 31, 2005
|
|
April |
Accrued |
||||
|
2006 |
2005 |
% |
2006 |
2005 |
% |
|
|
|
||||||
|
No. of Passengers (thous.) |
2,498 |
2,331 |
7.2 |
8,798 |
8,512 |
3.4 |
|
Domestic |
1,299 |
1,335 |
-2.7 |
4,706 |
4,802 |
-2.0 |
|
Medium range |
869 |
730 |
19.0 |
2,881 |
2,574 |
12.0 |
|
Europe |
816 |
689 |
18.4 |
2,701 |
2,422 |
11.5 |
|
Africa and Middle East |
53 |
41 |
29.3 |
180 |
152 |
18.6 |
|
Long-haul |
330 |
265 |
24.4 |
1,210 |
1,136 |
6.5 |
|
|
||||||
|
ASKs (millions) |
5,561 |
5,242 |
6.1 |
21,250 |
20,504 |
3.6 |
|
Domestic |
1,113 |
1,167 |
-4.6 |
4,529 |
4,574 |
-1.0 |
|
Medium range |
1,419 |
1,400 |
1.4 |
5,524 |
5,346 |
3.3 |
|
Europe |
1,262 |
1,247 |
1.2 |
4,941 |
4,794 |
3.1 |
|
Africa and Middle East |
158 |
153 |
2.7 |
583 |
552 |
5.6 |
|
Long-haul |
3,028 |
2,676 |
13.2 |
11,196 |
10,583 |
5.8 |
|
|
||||||
|
RPKs (millions) |
4,576 |
3,857 |
18.7 |
16,452 |
15,277 |
7.7 |
|
Domestic |
851 |
853 |
-0.3 |
3,066 |
3,138 |
-2.3 |
|
Medium range |
1,141 |
951 |
19.9 |
3,790 |
3,346 |
13.3 |
|
Europe |
1,018 |
853 |
19.4 |
Kontakt zum Verfasser der Nachricht: Kontaktformular anzeigen
[contact-form-7 id="53822" title="KontaktAutorArtikel"]
| ||


